Just announced:Sell through ChatGPT, Gemini and more →
Use AI to query data and generate insights in seconds
Centralise all your commerce data and build custom dashboards, reports and insights with AI.
Face it, your BI tool sucks. Most retailers waste hours gathering data, only to lose more time inside a spreadsheet.
Unifying data across systems, like point of sale, e-commerce and marketing requires a dedicated engineering team.
Inevitably, decisions are made without data backing them up.
retailQ is the better way. We connect your commerce platforms and unify your data. Ask our AI to build beautiful dashboards, A/B test initiatives or extract data.
It is built for everyone: marketing, merchandising, operations, and finance.
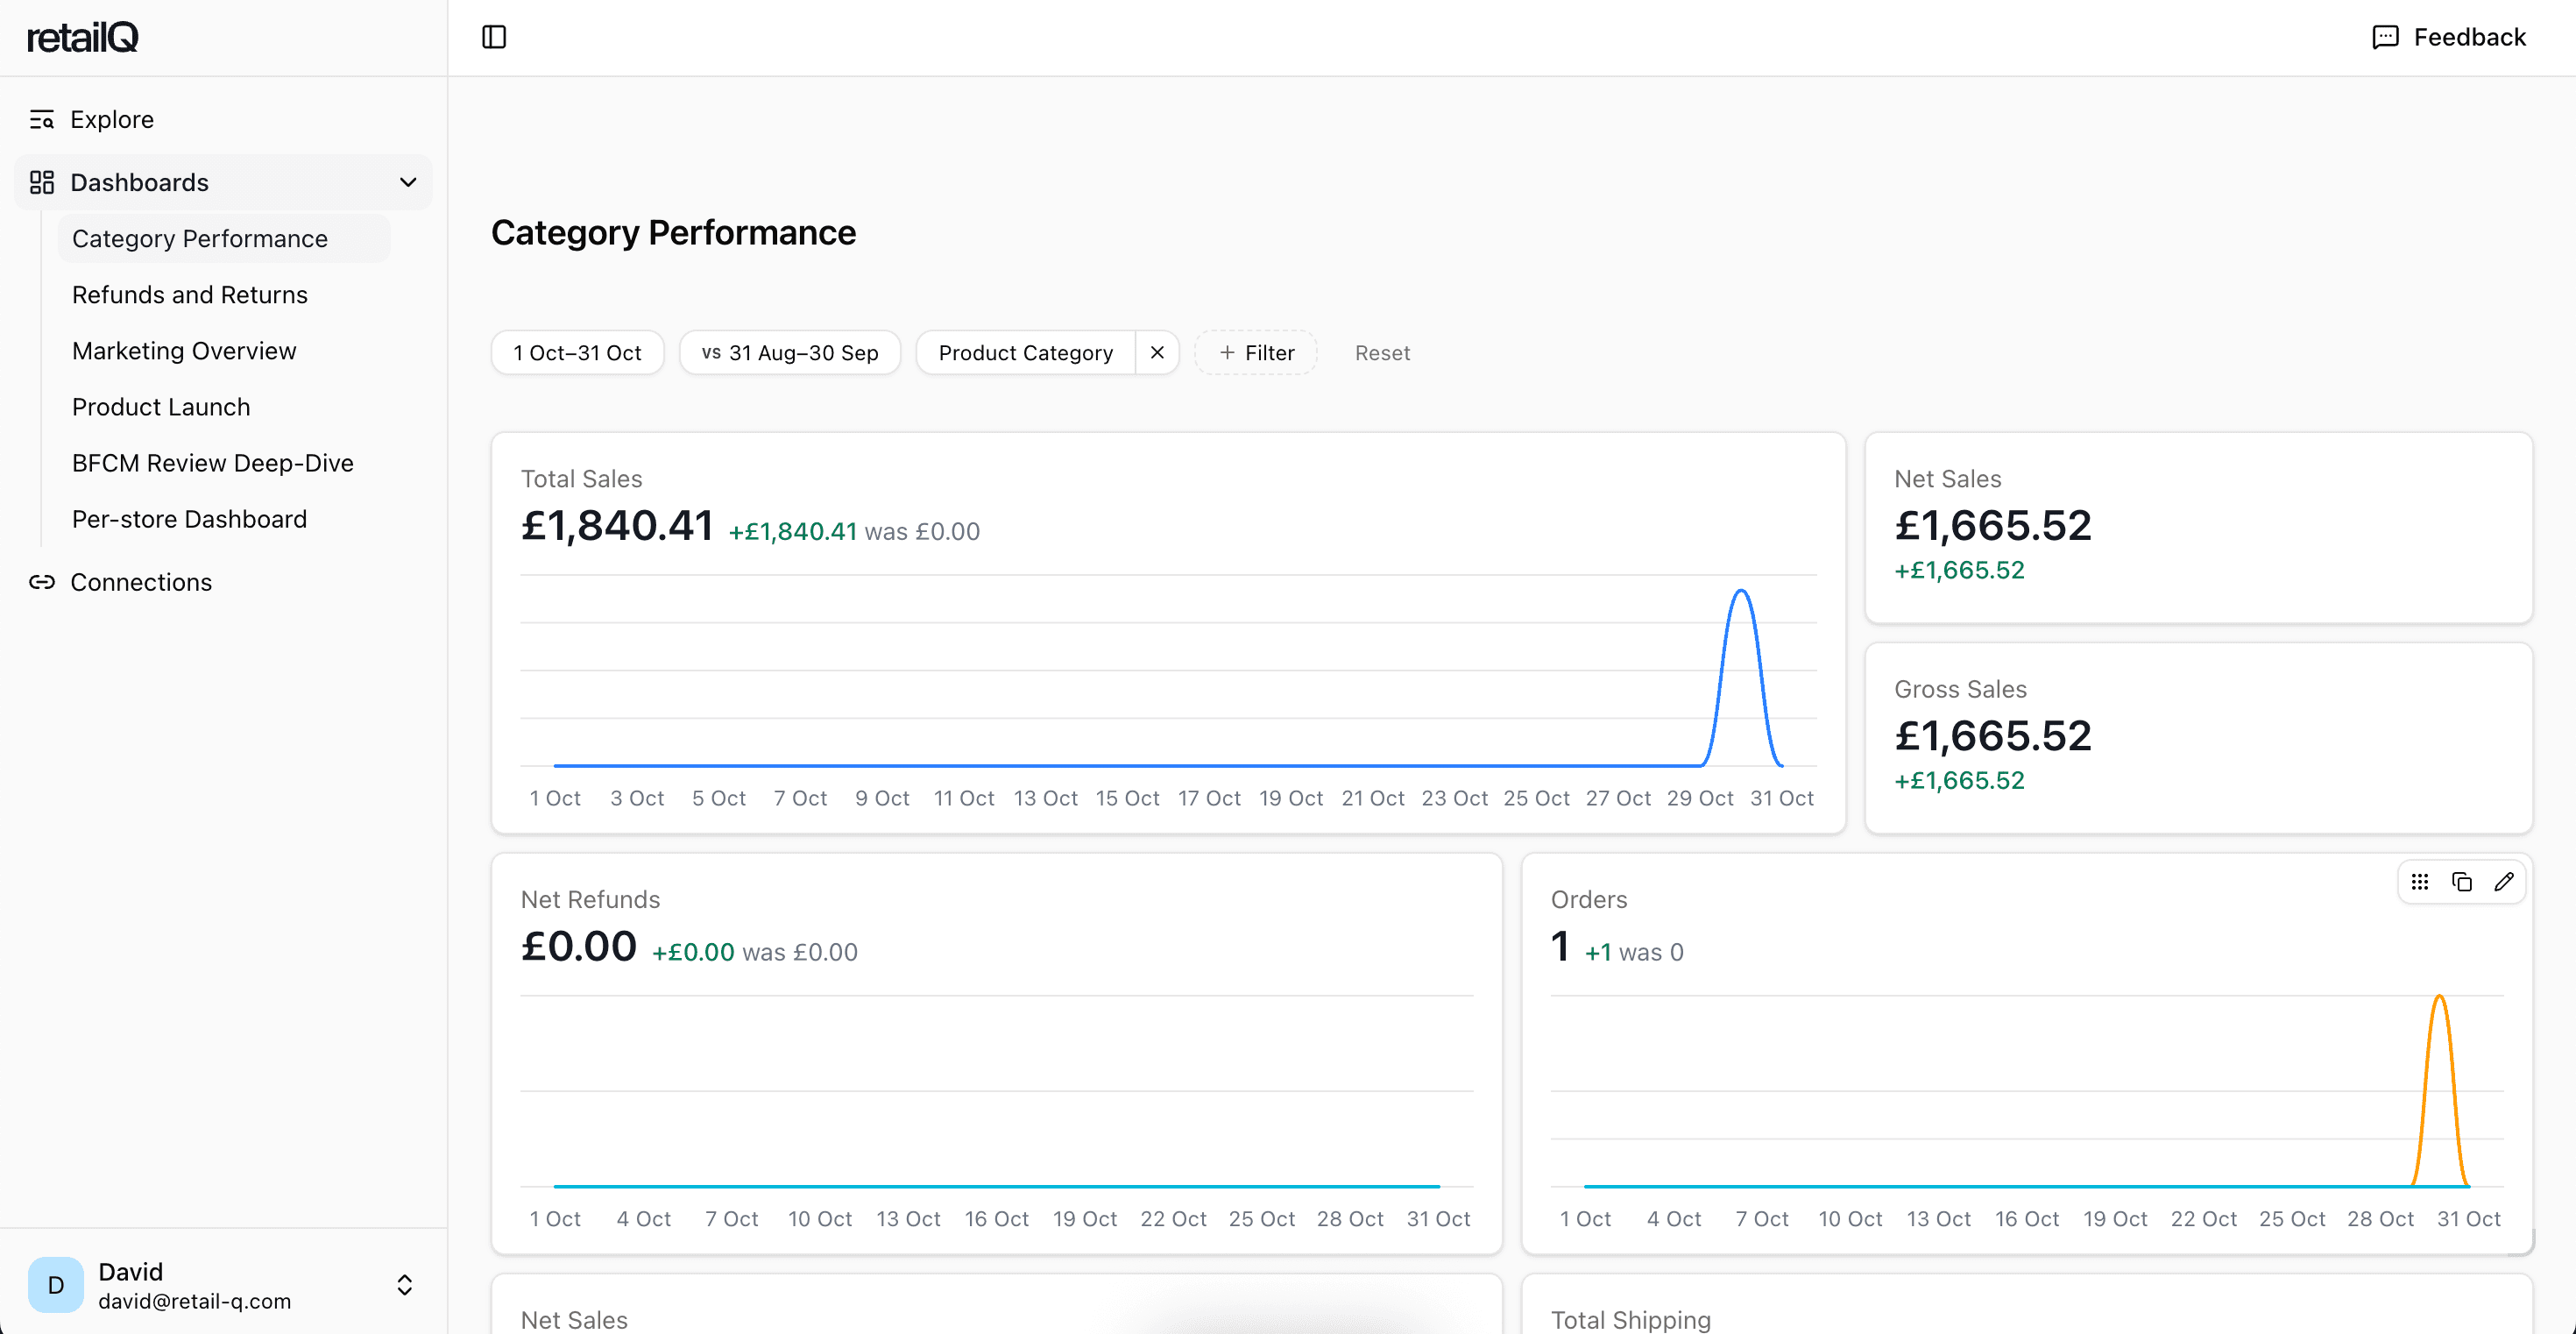
Customise unlimited dashboards to find the insights which matter. Create one for each store, new launch, marketing campaign or category.
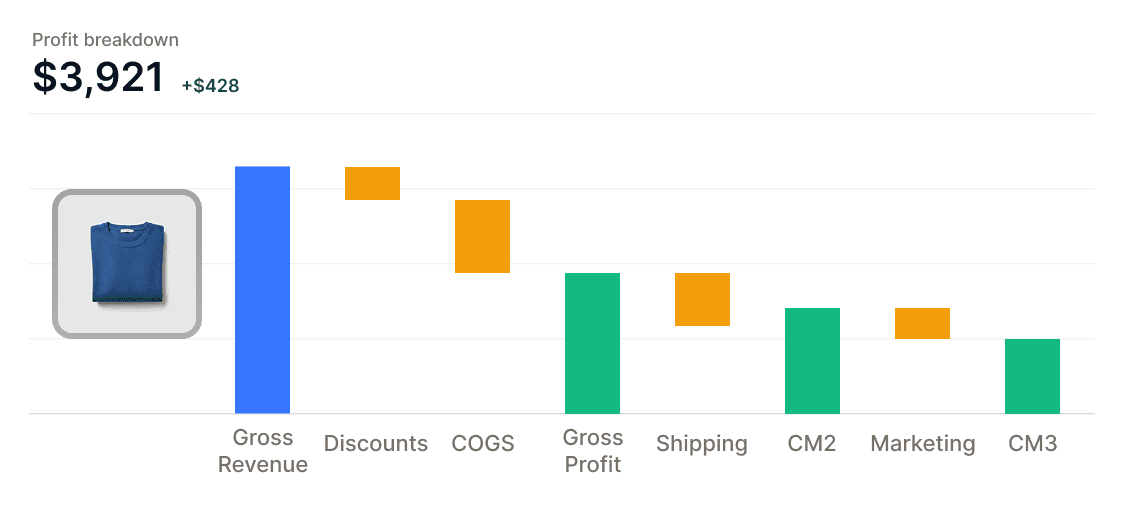
Maximise product profitability
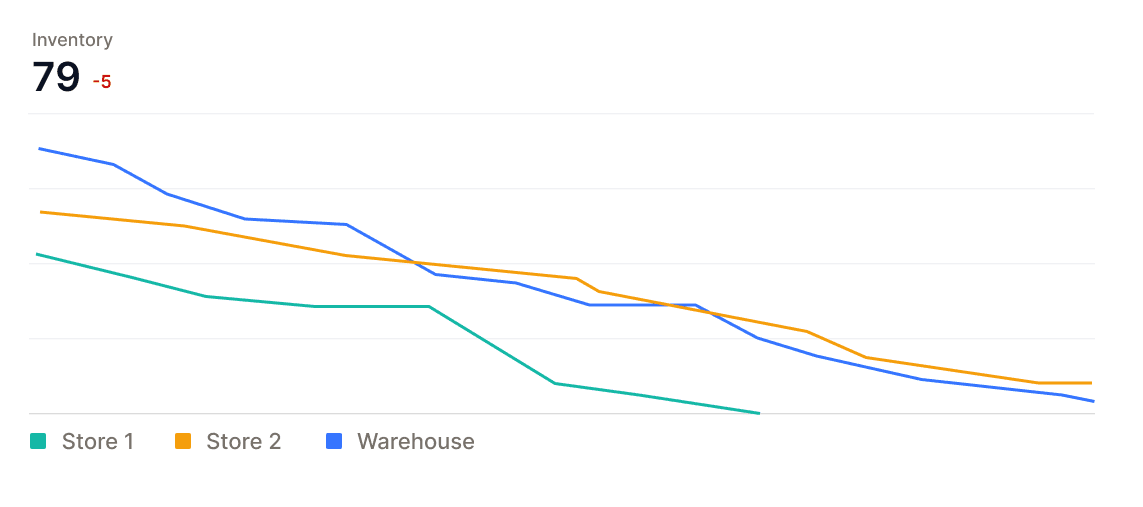
Forecast inventory and reduce stockouts
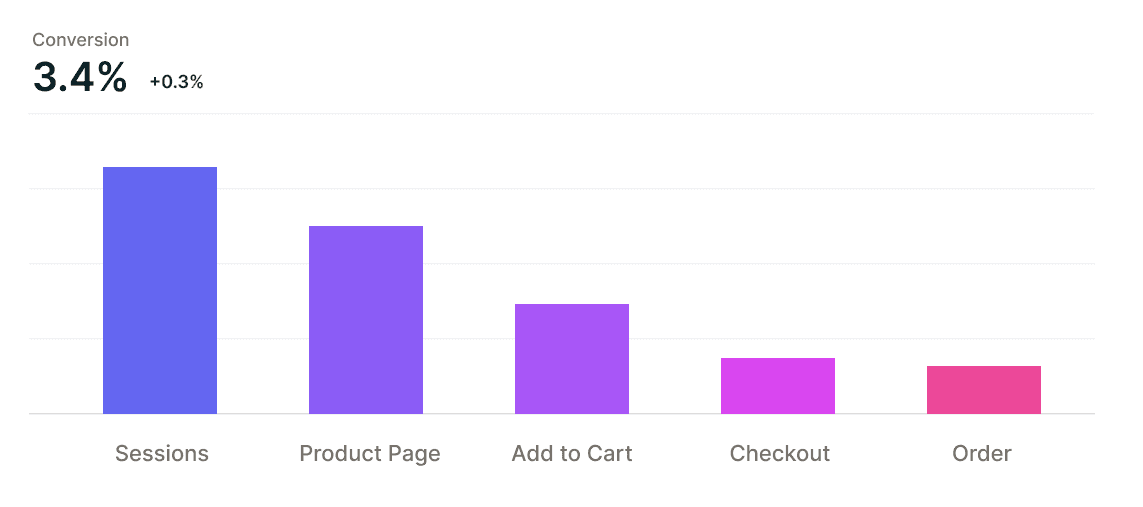
See where you lose customers online
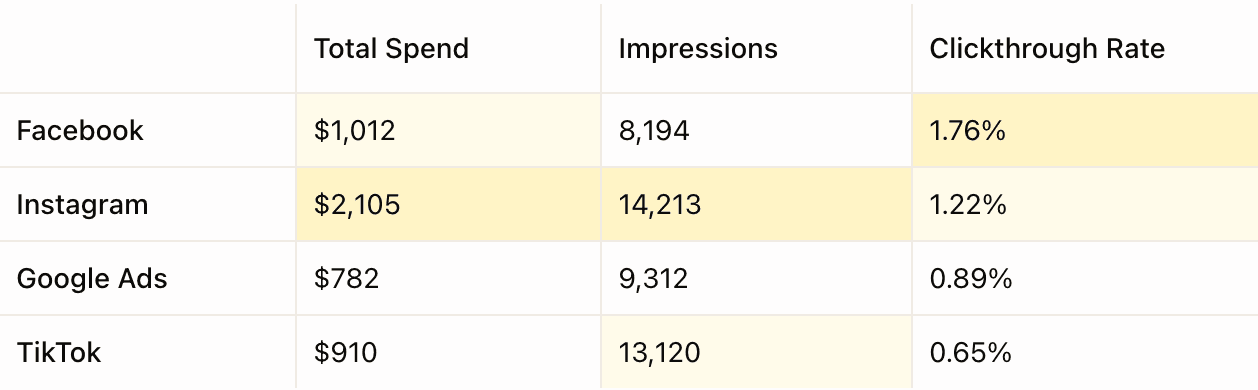
Optimize marketing effectiveness
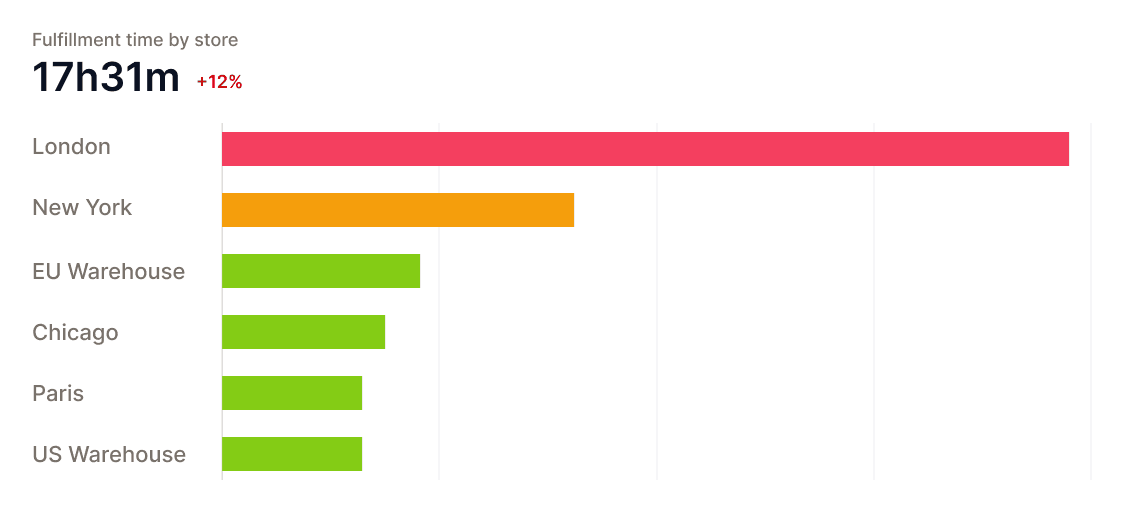
Identify operational inefficiencies
Increase customer retention and lifetime value

Compare metrics between any groups: customer segments, product categories, stores or campaigns to identify know what's working
 |  |  | |
|---|---|---|---|
| Clickthrough Rate | 3.10% | 2.85% | 1.30% |
| Conversion Rate | 1.02% | 1.56% | 0.80% |
| Total Spend | $1,012 | $2,105 | $1,575 |
| Return on Ad Spend (ROAS) | 3.05 | 2.85 | 1.30 |
| Profit on Ad Spend (POAS) | 3.01 | 2.31 | 1.07 |
Set up scheduled reports to be sent to your inbox, or export data in one click to carry on in Excel or Google Sheets


No spam: we share insights, guides and perspectives once or twice a month.